| exec | ||
| images | ||
| include | ||
| lib | ||
| src | ||
| test | ||
| .gitignore | ||
| LICENSE | ||
| platformio.ini | ||
| README.md | ||
Arduino-Photometrics
Arduino-photometrics is a sub-module of the Robot Go West project, developed as part of the projects at the Cohabit Fablab. The goal of this project is to collect local lighting data to train a prediction model capable of estimating the sun's position.
The system is structured as follows:
-
Embedded Layer: Developed in C++ for real-time data collection.
-
Data Management: Python scripts are used to update the RTC (Real-Time Clock) and extract measurement data from the device files.
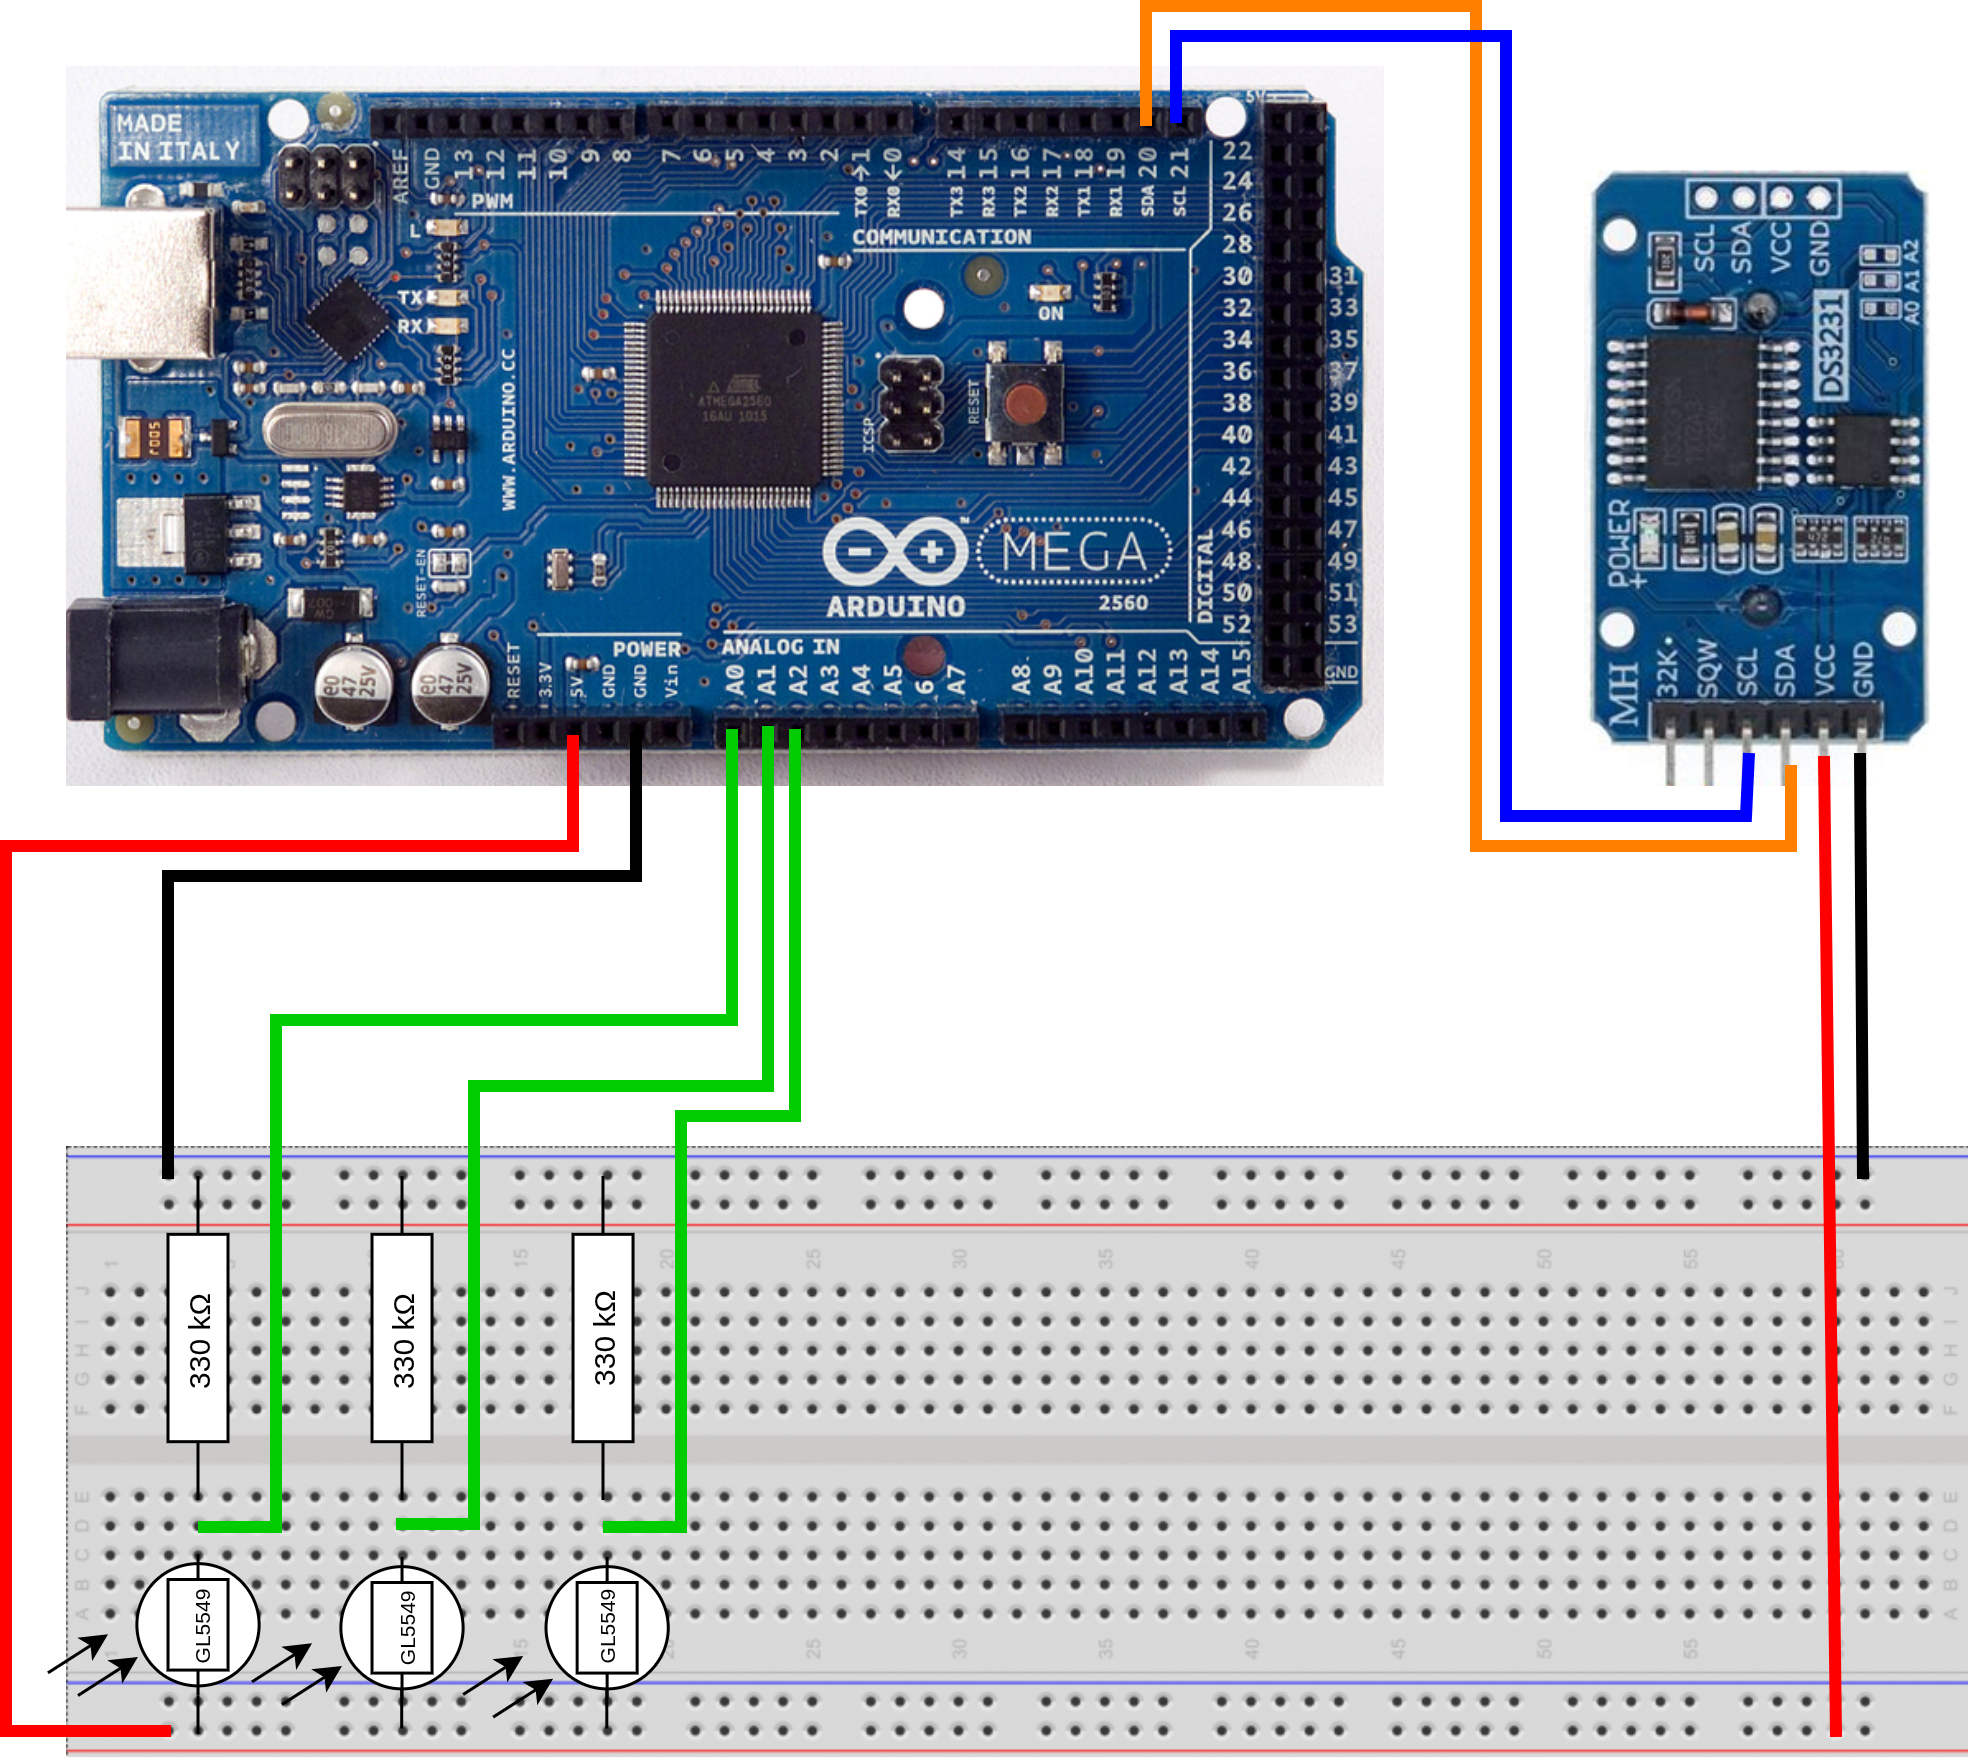
Arduino Mounting
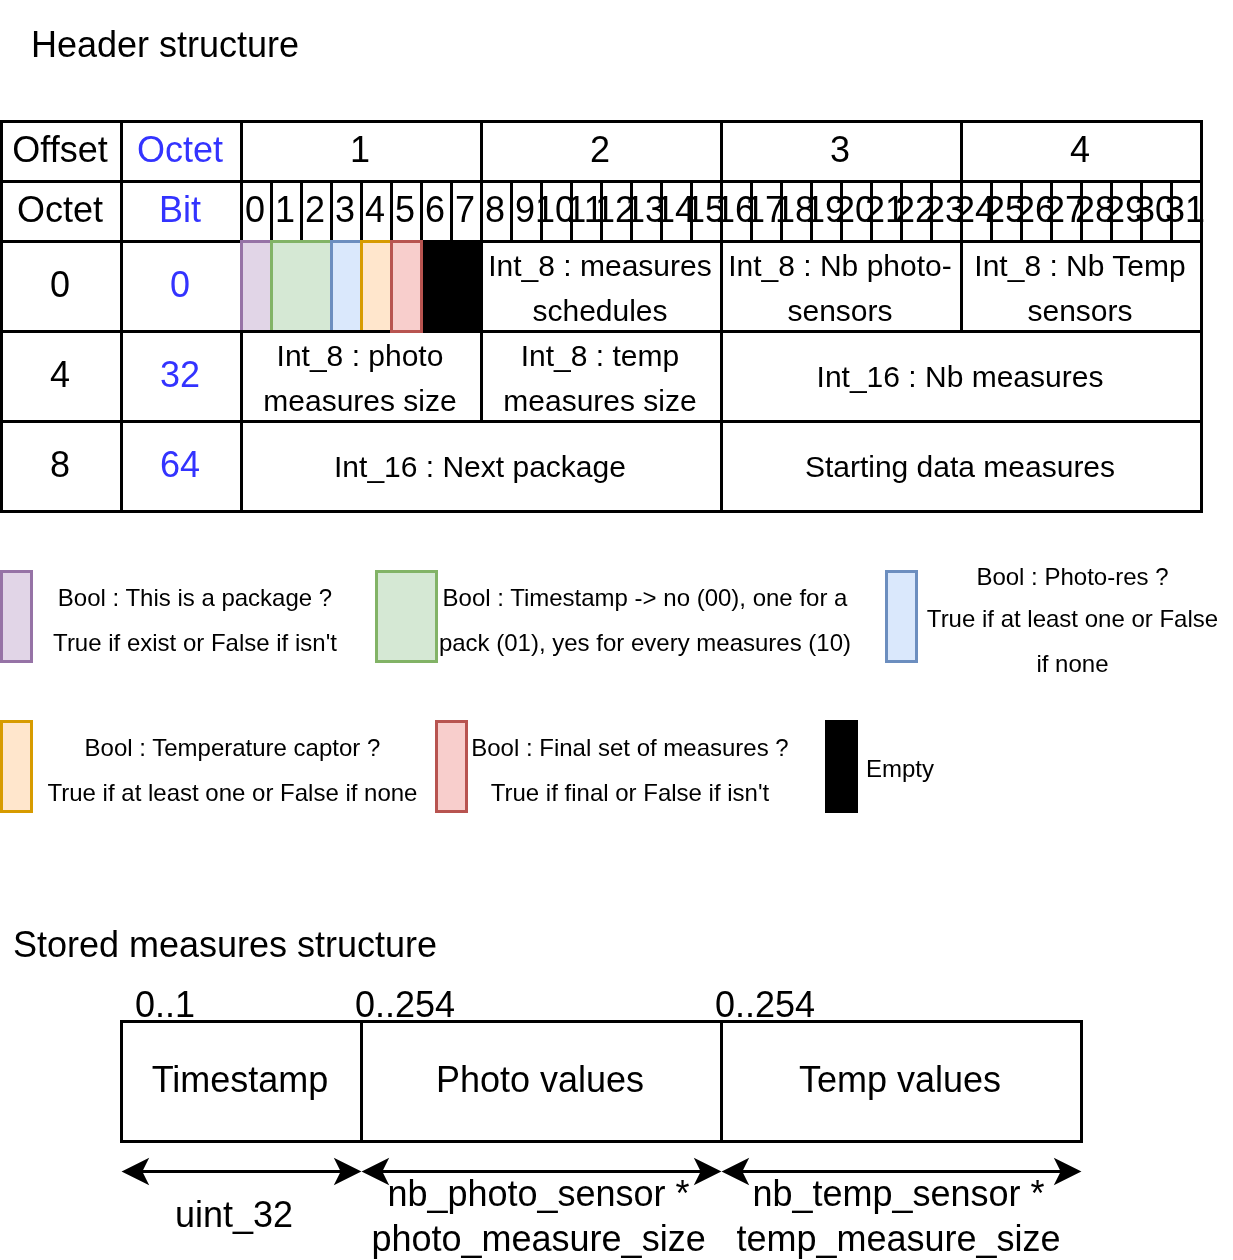
EEPROM Header and Data Storage
The system collects data and writes it to the EEPROM during deployment. To better understand the storage structure within the EEPROM, please refer to the diagram below.
Executable Files
All executable files are located in the exec/ folder.
Tutorial
1. Hardware Setup
- Assembly: First, assemble the Arduino (refer to the diagram above).
- 3D Printing (Optional): You can download and print the support from PotPhotoResistance, designed by Jhodi Avizara.
2. Software Configuration
- Download or clone the project from this repository.
- Open the project directory in VSCode with the PlatformIO extension.
- Ensure PlatformIO has successfully initialized the project.
3. Testing & Deployment
- Connect the Arduino to your PC.
- Run the project tests using the GUI or the command
pio test. - Upload the code to the Arduino.
- Perform the RTC update and the Sensor calibration.
- Important: Ensure the
serial_comflag is set tofalse(this boolean flag manages the switch between measurement and communication phases).
4. Data Collection
- Place the Arduino near a window and let it collect data.
- After a sufficient period, reconnect the Arduino to your PC.
- Retrieve the data using the Gather measures script.
Sensor calibration
The goal of this step is to determine the measurement range by identifying the lower and upper thresholds of your sensors.
- Setup: After completing the electrical assembly, call the
print_min_max_res()method from the SensorManager object within the main loop (then compile and upload to the Arduino). - Calibration:
- Dark state: Place the light sensors in a dark environment (e.g., inside a light-proof box) to record the minimum values.
- Bright state: Expose the sensors to direct sunlight or a bright lamp to record the maximum values.
- Configuration: Once you have the values from the Serial monitor, update the
min_resandmax_resvariables for each sensor in your code.
The software will automatically normalize these values to fit into a uint8_t type. This compression minimizes the data size, allowing for more efficient storage in the EEPROM.
RTC Update
- Enable Debug Mode: Before building the project, uncomment the
-D DEBUGline inplatformio.ini. - Set Phase: Ensure the device is in the Communication Phase.
- Monitor Serial Port: Check the serial output to verify the current date and time.
- Sync Time: If the date is incorrect, run the
time.pyscript located in theexec/folder:
The Python script synchronizes the Arduino's RTC with the computer's system clock via Serial communication.python3 exec/time.py
Gather Measures
After the data collection period is complete:
- Switch Mode: Set the device to the Communication Phase.
- Download Data: Run the
download_csv.pyscript to retrieve your measurements and generate a CSV file:
Important: The download process will wipe the entire Arduino EEPROM memory to prepare it for the next collection cycle.python3 exec/download_csv.py
Set Communication Phase
- Connect the Arduino to your PC.
- Set the
serial_comboolean flag totruein the code. - Warning: To avoid data corruption, ensure the system is not actively writing measurements to the EEPROM before uploading the new configuration.
Known Limitations & Future Improvements
Data Structure
- Current Issue: The storage system is optimized for
uint8_tdata types. - Limitation: Generic template functions for other data types are currently non-functional. Implementing a flexible template system is planned for future versions.
Power Management
- Current State: The system is designed for a continuous power supply (standard electrical outlet).
- Improvement: Future hardware and software iterations will focus on battery-powered operation and low-power sleep modes to enable true portability.
CI/CD Pipeline (GitLab)
- Current Issue: The automated pipeline currently fails during virtual hardware testing.
- Challenge: Need to configure serial port interfacing between the Virtual Machine (VM) and the pipeline runner to enable remote hardware-in-the-loop testing.
Calibration Process
- Improvement: Develop an assisted calibration tool to automatically capture and store threshold values, replacing the current manual code update process.
Prediction Model
The system is designed to monitor solar irradiance from a fixed position (e.g, my system is positioned behind a window with a 109° East-of-North orientation).
The goal is to map the internal lighting patterns to the sun's actual coordinates, allowing the model to estimate the sun's position based solely on photometer data.
Credits
This project was entirely developed by Aurélien Gauthier.
The 3D model for the sensor support was designed by Jhodi Avizara.
Dependencies & Libraries
This project utilizes the following libraries:
- Low-Power: Used for power management and system sleep cycles.
- DS3231 Lib: Used for interfacing with the DS3231 RTC module.